Since we’re wrapping up the 3rd quarter of 2014, we thought it would be a nice time for a review of the real estate market in 85255. Below are 3 graphs which give you an idea of what is happening in the market in terms of active listings, number of sales, and average sales price per square foot sales for single family homes in 85255.
All data and graphs were obtained from Michael Orr’s Cromford Report.
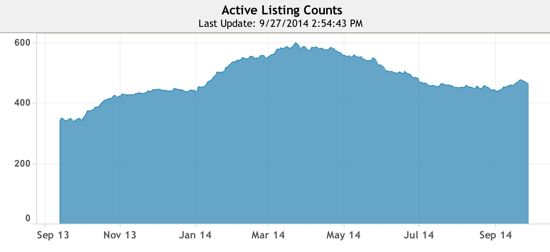
Let’s start with the first chart, active listings.

Active listings in 85255, single family homes (no condos), normal transactions only (no distressed sales.)
The chart above depicts active listings in 85255 in the last year. These are normal listings (not foreclosures or short sale listings.) As you can see, the number of active listings is significantly higher today than it was at the end of September 2013.
For example, the number of listings on September 26, 2013 was 345. In comparison, the number of active listings on September 26, 2014 was 467. That’s a 35% increase year over year.
You will also see that the number active listings was on the rise all throughout the last quarter of last year (actually the trend upwards began in July, 2013) and continued until March of this year. (The peak was 600 listings on March 23rd, 2014.) Interestingly, the total number of active listings has been gradually falling from March’s peak through the end of August, but has begun to rise again during the month of September.
We expect the total number of listings to continue to rise through the fall, although let’s hope the pace is less than last year’s. There are a number of sellers who took their homes of the market in the summer, and are ready to re-list for the fall and winter market, when sellers traditionally expect to see more buyers looking at homes.
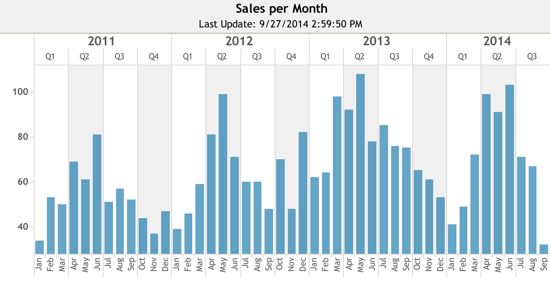
The next chart examines sales per month and documents the last 4 years of sales – 2011 through the 3rd quarter of 2014.

Sales per month in 85255, single family homes (no condos), normal transactions only (no distressed sales.)
The most obvious thing you will notice is that the seasonal fluctuation is consistent from year to year. The number of sales per month typically peaks in the months of April, May and June (the exception was last year, 2013, when sales peaked in March, April and May.)
We still believe that the summer is a great time to have your home listed for sale. Yes, there are less sales that take place, but sellers who are on the market in the summer have the benefit of competing against less listings.
For example, looking again at the first chart, there were 450 active listings on July 30th, compared to 600 active listings on March 23rd. That’s a 25% drop!
The number of sales for September 2014 sat at only 32 sales through September 27th. However, we expect that number to jump up somewhat when the final numbers for September are tallied as there are always a considerable proportion of closings that take place at the end of any calendar month.
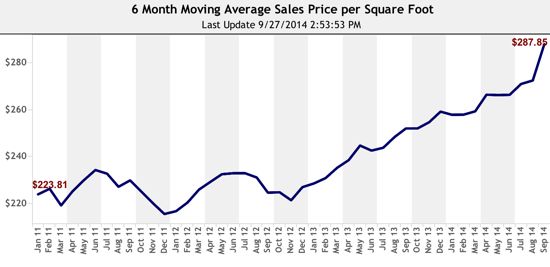
Now for our final chart: The 6 month moving average sales price per square foot appears to have been on a upward trend since December of last year. On December 11, 2013, average price per square foot was $215. On September 14, 2014, it was $288.

Average sales price per square foot in 85255, single family homes (no condos), normal transactions only (no distressed sales.)
However, much of the upward trend in average price per square foot can be attributed to the fact that a significant portion of sales that have taken place in the last year have been in the higher price points, where price per square foot is also higher, thereby skewing this number for the overall market.
We are Scottsdale real estate agents who specialize in the DC Ranch area. Contact us for more information on the DC Ranch community, real estate trends, and DC Ranch homes for sale.
Don Matheson
Realtor | Founder
The Matheson Team – RE/MAX Fine Properties
21000 N. Pima Rd., #100, Scottsdale, AZ 85255
480-360-0281
don@scottsdalerealestate.com


